

In an ISO 27001 audit, I always ask for the network diagram. What I regularly receive is three boxes, “Internet”, “Firewall”, and “Servers”, joined by two arrows. No date, no name.
These diagrams are accurate. They show nothing.
A technical drawing exists to answer a precise question. If nobody knows which one, you draw three boxes.
A reminder: ISO 27001 requires no diagram
ISO 27001 names no diagram. Clause 7.5 leaves it to the organization to decide which documentation it needs. ISO 27002, the guidance that accompanies the standard, is what recommends, in control 8.20, keeping local area network (LAN) and wide area network (WAN) diagrams up to date, with version control.
The auditor will ask for one anyway. Without a drawing, how do you show that your networks are segregated (8.22), that your suppliers’ network services are controlled (8.21), or that the scope declared in clause 4.3 matches reality?
PCI DSS is much more direct. Requirement 1.2.3 asks you to maintain an accurate network diagram that shows every connection between the cardholder data environment and other networks, including wireless. It has to be updated when the environment changes. Requirement 1.2.4 also asks you to maintain an accurate diagram of all account data flows across systems and networks, and to update it as needed when the environment changes.
In other words, both diagrams have to remain true between audits. Every change that alters what they represent has to trigger an update. The annual PCI DSS scope confirmation required by 12.5.2 also verifies that they still match reality. That is not a suggestion.
Bill 25 does not require a drawing either. Before you communicate personal information outside Quebec, though, you have to complete a privacy impact assessment (PIA). Hard to write one if you do not know where the data goes.
Three drawings, three questions
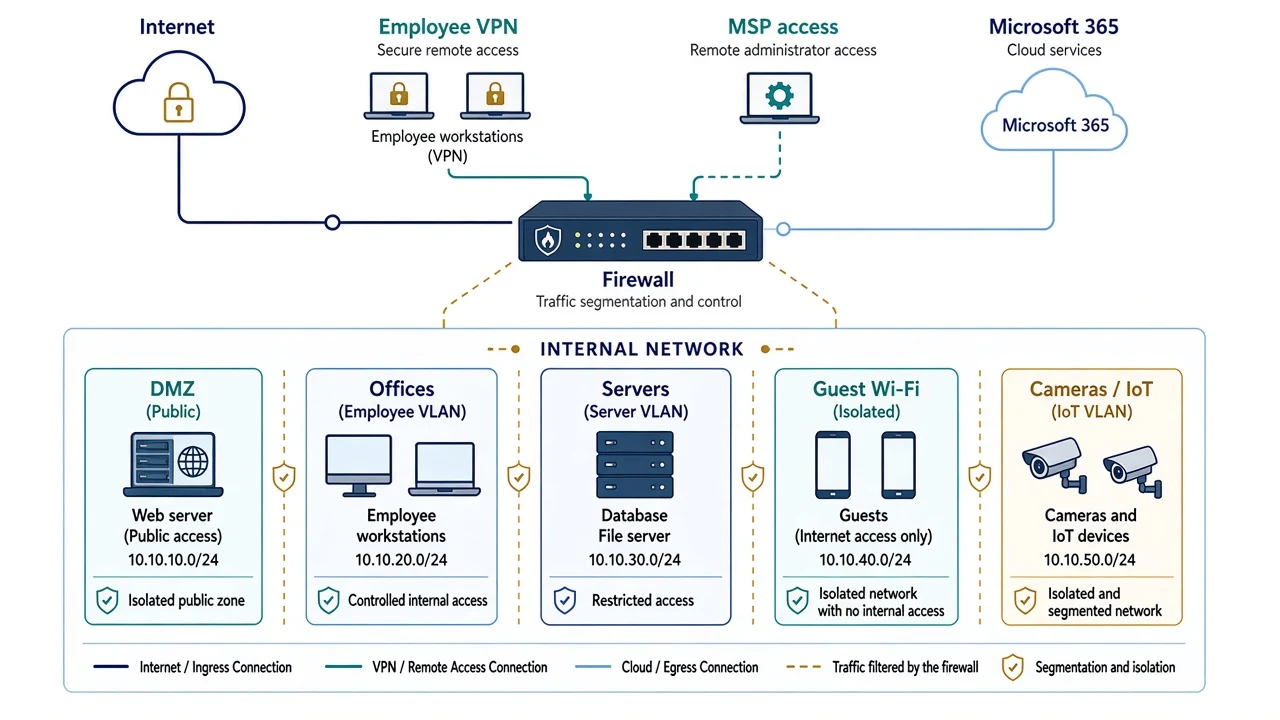
The network diagram: how is it connected?
This is the map of the plumbing. It is for your MSP, your IT lead, and the auditor. You look at it before a configuration change, to check segmentation, and on the day something stops working.
At a minimum, it has to show:
- zones and segments (VLANs, a demilitarized zone or DMZ, guest Wi-Fi, the camera network or the phone network) and their IP address ranges;
- the firewalls and what they separate;
- every connection to the outside, such as the Internet link, the employee VPN, the MSP’s remote access, and the links to the cloud;
- equipment installed by third parties, such as the heating system, cameras, or production controllers (I wrote about this in my article on threat intelligence);
- a date, a version, and an owner.
A fictional example, for an SMB:
The architecture diagram: what is the system made of?
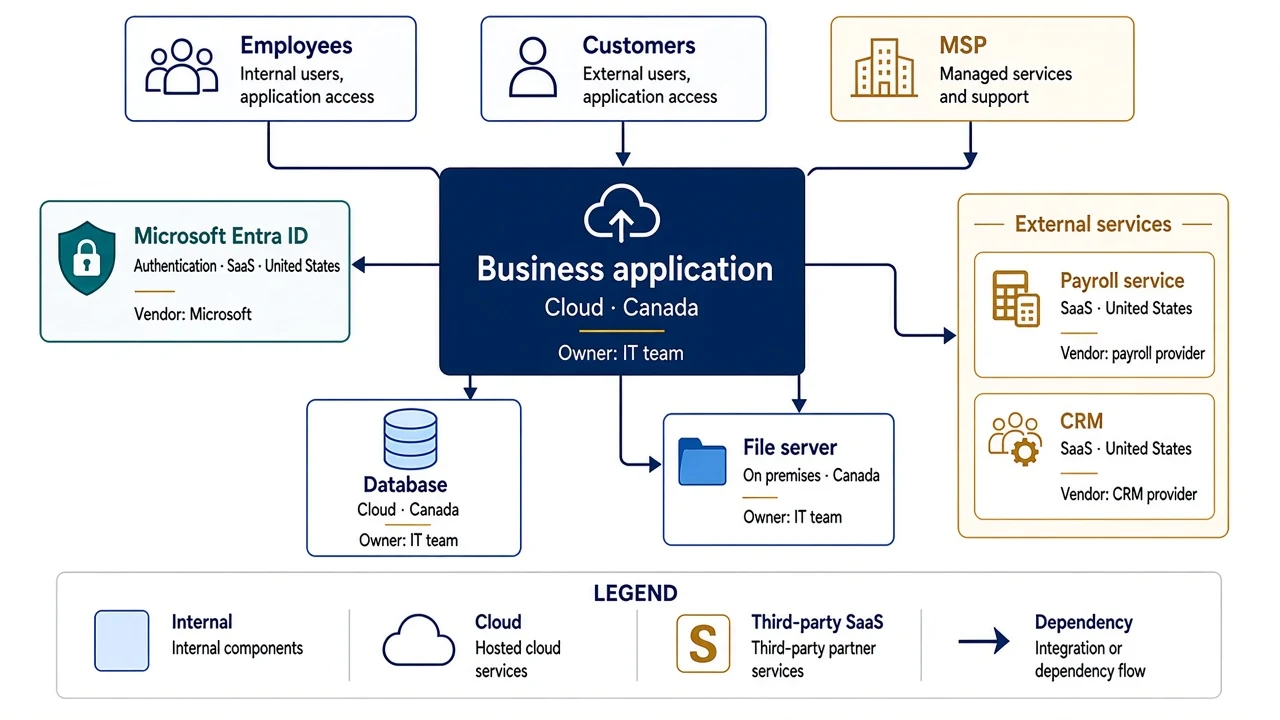
Here you stop drawing cables. You draw the pieces of a system and what depends on what. The business application, its database, the service that authenticates users (often Microsoft Entra ID), the SaaS services connected to it, and the vendors that operate them.
It is useful in three situations above all. At the start of a project, to do the risk analysis before you build anything. In business continuity, to answer “if this service goes down, what goes down with it?”. And for your vendor review, because it shows who touches what.
At a minimum, it has to show the components, where each one is hosted (on premises, in the cloud, or as SaaS, and in which country), the dependencies between them, the authentication service, and the vendor responsible for each piece. If you want a simple method, the C4 model suggests starting with a context view (the system and what surrounds it), then a container view (applications and databases). For an SMB, those two levels are enough.
A fictional example, at the container level:
The data flow diagram: where does the information go?
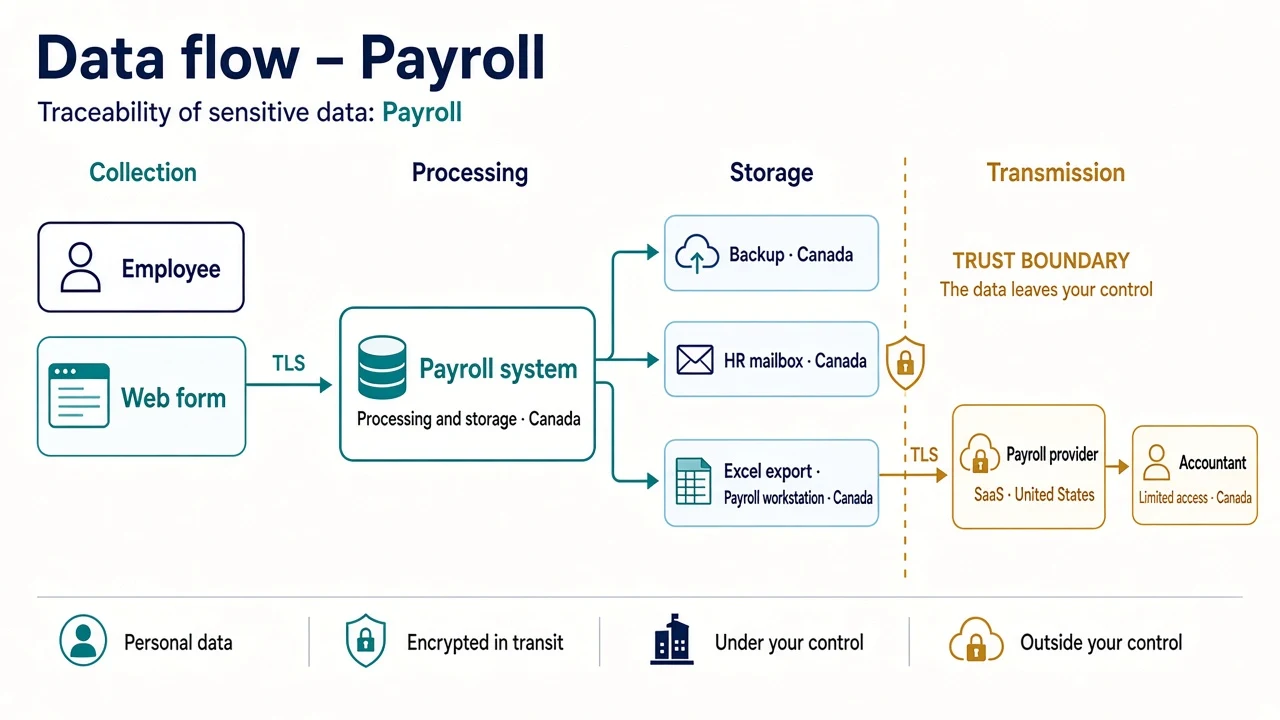
This one follows the data, not the cable. It is the most useful one for Bill 25, and the only one I rarely see done well.
At a minimum, it has to show:
- where the data comes from (web form, employee, partner);
- where it is processed and stored, including backups, mailboxes, and Excel exports;
- who it is sent to (payroll provider, customer relationship management system, accountant);
- the trust boundaries, meaning the point where the data leaves your control;
- whether it is encrypted in transit;
- which country it ends up in;
- the role of each organization: who determines the purposes and means of processing, and who processes the information on its instructions.
Make one per type of sensitive information (payroll, client files, health records), not a single one for the whole organization.
In privacy frameworks, the first role is often called the controller. The organization acting on its behalf is the processor. Those terms come mainly from the GDPR and ISO 27701. Under Bill 25, it is clearer to speak of the business and its service provider. Giving the processing to a provider does not release the business from accountability. The diagram should show who decides, who processes, and who answers for protecting the information. I explained these roles here.
The drawing also has to agree with your inventory of personal information and processing activities. If the inventory names a payroll provider in the United States but the diagram stops at the payroll system, one of the two documents is wrong. Systems, copies, recipients, countries, and owners have to tell the same story.
A fictional example, for payroll only:
Which drawing, and when?
| Situation | Diagram to have |
|---|---|
| ISO 27001 audit | All three, network first |
| PCI DSS | Network and data flow (mandatory) |
| Bill 25 PIA, transfer outside Quebec | Data flow |
| New MSP | Network diagram, handed over on day one |
| New application or project | Architecture, then data flow |
| Incident | An up-to-date network diagram that existed before the incident |
What makes a diagram useless
Too simple. The three boxes from the introduction. That is a drawing of intent, not documentation.
Too complex. The opposite mistake, which I also see regularly. A page with two hundred devices, generated by a network discovery tool. Nobody reads it, so nobody corrects it. The enemy of security is complexity. One drawing per question, rather than one drawing that answers everything.
The ideal instead of the real. I often find that the diagram handed over is the one from the original project, drawn before every exception that was added “temporarily” to the firewall.
No date, no owner. Impossible to know whether it is still true.
Only at the vendor. I often see organizations whose diagram lives in their MSP’s tool, not in their own files. The day you change vendors, you start over. The documentation belongs to you.
Sent to everyone. A good network diagram is also a map for an attacker. Classify it (control 5.12) and limit who can see it.
In practice
Here are the questions I ask in an audit. If you answer no to more than two, your diagram is not helping you yet.
- Is the diagram dated, versioned, and does it name an owner?
- Do you know what triggers an update (network change, new vendor, annual review)?
- Does it show your MSP’s remote access?
- Does it show what is in the cloud and in SaaS?
- Can someone who does not know your organization see, in five minutes, what is separated from what?
- For your most sensitive personal information, can you follow its path from collection to destruction?
- Is a copy in your files, rather than only at your vendor?
Which tool should you use?
The problem was never the tool. Several free options do the job very well:
- draw.io (also called diagrams.net): free and open source, with network, Azure, and AWS icons. The desktop version works offline and keeps the files on your computer. It is my first choice for a network diagram.
- Visio in Microsoft 365: the basic web version is included at no extra cost in Microsoft 365 Business Basic, Standard, and Premium. If you have Microsoft 365, you probably already have it.
- Excalidraw: free, with a hand-drawn style. A good fit for a first architecture sketch in a meeting.
- Mermaid: the diagram is written as text and draws itself. It renders directly in GitHub, GitLab, or Azure DevOps, so you can track versions the way you track code. A good fit for data flows in a development team.
- Lucidchart: the free version is limited to three editable documents and 75 shapes per document. Fine for a trial, too limited to document a real network.
One caution: an online tool keeps your diagram on someone else’s servers. For a detailed network diagram, prefer a desktop version or a tool hosted in your own environment.
In short
Before you draw, write at the top of the page the question the drawing answers. Three boxes rarely answer a question an auditor will ask.
When was your network diagram last updated?
An audit is coming and you are not sure your diagrams will hold up? Let’s talk.